 Cat Trivia Games
iOS App
Are Black Cats Adopted Less? Adoption Rates at 7 Shelters
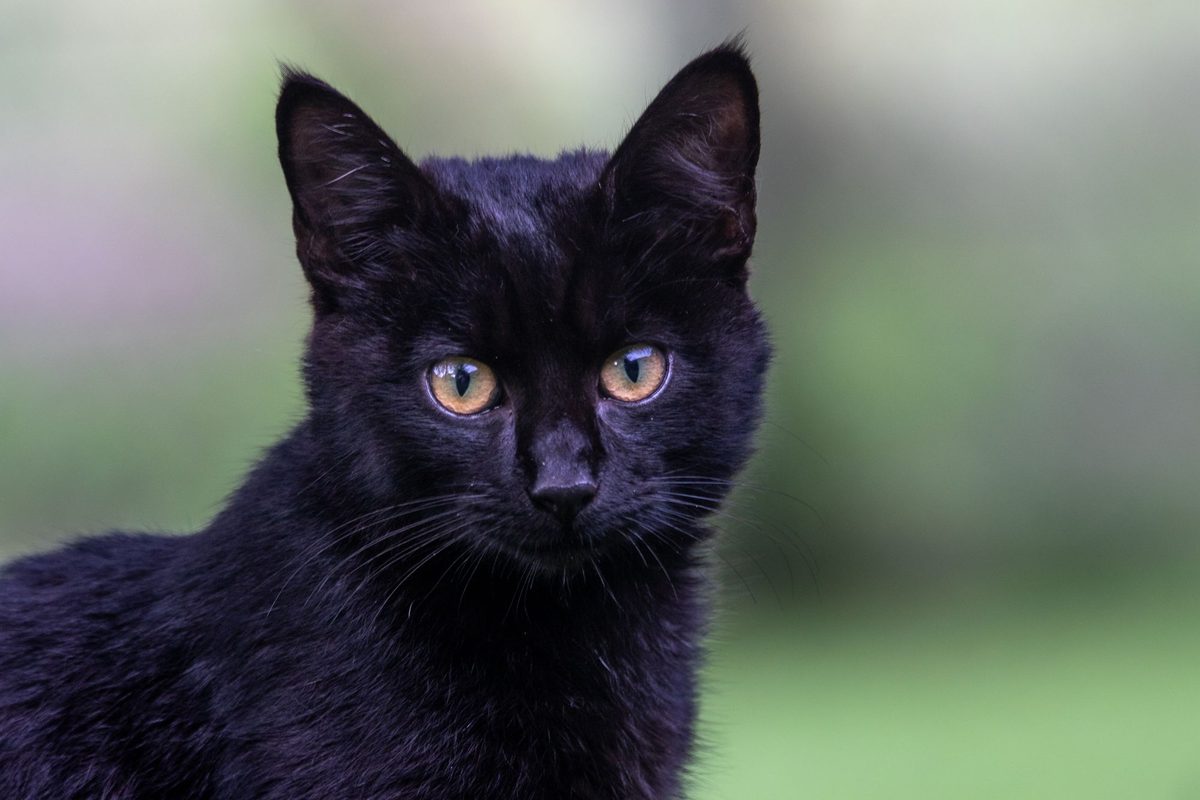
Yes, black cats are adopted a little less often, but the gap is small. I counted 157,959 cat stays at seven US animal shelters whose public records include coat color and how each stay ended, and at every one a smaller share of black cats left by adoption: 51.8% of black cats against 53.6% of cats of other colors. Compared with cats of the same age at the same shelter, black cats had about 12% lower odds of adoption and stayed about 16% longer. Black-and-white cats showed no adoption gap.
Key findings
- A smaller share of black cats was adopted in all eight datasets from seven shelters. The gap runs from 0.7 percentage points in Louisville, Kentucky,7 to 5.7 in Austin, Texas, in records since May 2025.2
- About half of black cats still found homes: 13,956 of 26,928, or 51.8%, against 53.6% of other cats.
- The gap is about the same for kittens, adults and seniors: roughly 2 to 4 fewer adoptions for every 100 black cats, compared with other cats of the same age.
- Among groups with at least 100 adopted black cats, the longest extra wait was for black kittens in Long Beach, California: a median of 45 days to adoption, against 32 days for other kittens.3
- Age matters more than color. Compared at the same shelter, cats 10 and older had about 39% lower adoption odds than cats aged 1 to 9, against 12% lower for black cats.
Jump to: Every shelter, Kittens, adults and seniors, Full table, Waiting time, Other colors, Earlier studies, Method, Use this data, How to help
Black cat adoption rates at each shelter
Eight public datasets from seven shelters record both a cat's coat color and how its stay ended: Austin, Texas, in two record systems,12 Long Beach, California,3 Sonoma County, California,4 Norfolk, Virginia,5 Montgomery County, Maryland,6 Louisville, Kentucky,7 and Sacramento, California.8 I combined them on November 19, 2026 and kept the cats that left by adoption, transfer to another group, euthanasia or death.
Black cats were adopted less in every dataset. The biggest gaps are 5.7 percentage points in Austin's newest records and 5.5 in Sonoma County, which means about 5 or 6 fewer adoptions for every 100 black cats. Louisville is close to no gap at all: 62.2% of black cats were adopted against 62.9% of other cats, and adopted cats of both groups waited about the same time, 35 and 34 days.7
| Shelter | Black adopted | Others adopted | Gap | Days, black | Days, other | Black cats |
|---|---|---|---|---|---|---|
| Austin, 2025 to 2026 | 52.7% | 58.4% | 5.7 | 18 | 21 | 752 |
| Sonoma County | 42.6% | 48.1% | 5.5 | 28 | 27 | 1,442 |
| Norfolk (main color only) | 58.0% | 61.3% | 3.3 | 37 | 31 | 5,989 |
| Austin, 2013 to 2025 | 51.5% | 54.4% | 2.9 | 30 | 24 | 8,705 |
| Sacramento (main color only) | 55.0% | 57.6% | 2.6 | 54 | 47 | 3,082 |
| Montgomery County | 71.8% | 74.0% | 2.2 | 18 | 15 | 2,052 |
| Long Beach | 27.6% | 29.4% | 1.8 | 44 | 33 | 3,545 |
| Louisville | 62.2% | 62.9% | 0.7 | 35 | 34 | 1,361 |
Compare black and other cats within a row, not across rows. Adoption levels depend on each shelter's mix of cats and on how many it sends to rescue partners. Long Beach, for example, transferred 46.1% of its black cats and 46.2% of its other cats to other groups, and those cats do not count as adopted here.3
Where did the other black cats go? In the six datasets that record a second color, 37.9% of black cats were transferred to rescue groups or other shelters, against 36.0% of other cats, and 10.4% were euthanized, against 9.5%. A transferred cat may still be adopted later through a rescue group, but these records stop when a cat leaves the shelter. The euthanasia share was a little higher for black cats in seven of the eight datasets. The files hold no health details, so they cannot show why.
Kittens, adults and seniors
Adopters often pick by age, so I also compared black cats only with cats of the same age at the same shelter. The gap shows up at every age, and it is about the same size each time.
| Age at arrival | Black adopted | Others adopted | Days, black | Days, other | Black cats | Black cats' odds |
|---|---|---|---|---|---|---|
| Kittens (under 1) | 52.0% | 55.4% | 31 | 27 | 12,255 | 12% lower |
| Adults (1 to 9) | 48.5% | 50.7% | 22.5 | 18 | 4,087 | 12% lower |
| Seniors (10 and up) | 36.2% | 39.9% | 37.5 | 29 | 398 | 13% lower, uncertain |
Black kittens were adopted less at all seven datasets that list kittens, and black adults at all six that list adults. Seniors split three and three. Black seniors did a little better than other seniors in Montgomery County, Norfolk and Sonoma County, and worse in both Austin datasets and Long Beach. Each dataset has only 16 to 169 black seniors, so a few cats can swing those numbers. Pooled, the senior gap could be anything from 31% lower odds to 8% higher.
Age matters more than color. In the five datasets with full color records that list seniors, cats 10 and older had about 39% lower adoption odds than cats aged 1 to 9 at the same shelter, against 12% lower for black cats. A black senior faces both: 36.2% of the 398 black seniors were adopted, against 50.7% of adult cats of other colors.
Every shelter and age band
This is the full table, the same one that is in the download. Long Beach kittens stand out. Black kittens there waited a median of 45 days to be adopted, against 32 days for other kittens, even though their adoption share was only 1.2 points lower.3 Austin's new record system is the one dataset where, across all ages, adopted black cats left sooner: 18 days against 21, for 396 adopted black cats.2
| Shelter | Age | Black adopted | Others adopted | Days, black | Days, other | Black cats | Other cats |
|---|---|---|---|---|---|---|---|
| Austin, 2013 to 2025 | All ages | 51.5% | 54.4% | 30 | 24 | 8,705 | 55,915 |
| Austin, 2013 to 2025 | Kittens | 55.5% | 58.6% | 32 | 28 | 6,279 | 38,307 |
| Austin, 2013 to 2025 | Adults | 41.3% | 45.3% | 24 | 17 | 2,257 | 16,228 |
| Austin, 2013 to 2025 | Seniors | 39.6% | 44.5% | 38 | 29 | 169 | 1,379 |
| Austin, 2025 to 2026 | All ages | 52.7% | 58.4% | 18 | 21 | 752 | 5,142 |
| Austin, 2025 to 2026 | Kittens | 54.8% | 59.1% | 20 | 23 | 566 | 3,744 |
| Austin, 2025 to 2026 | Adults | 69.3% | 70.7% | 16 | 13 | 114 | 1,042 |
| Austin, 2025 to 2026 | Seniors | 37.5% | 49.3% | 47 | 15 | 16 | 71 |
| Long Beach | All ages | 27.6% | 29.4% | 44 | 33 | 3,545 | 19,868 |
| Long Beach | Kittens | 29.1% | 30.3% | 45 | 32 | 2,756 | 14,477 |
| Long Beach | Adults | 28.5% | 30.3% | 41 | 36 | 555 | 4,191 |
| Long Beach | Seniors | 15.4% | 25.2% | 36.5 | 40 | 65 | 449 |
| Louisville | All ages | 62.2% | 62.9% | 35 | 34 | 1,361 | 8,612 |
| Louisville | Kittens | 65.1% | 65.6% | 46 | 44 | 873 | 5,370 |
| Louisville | Adults and seniors | 57.0% | 58.4% | 18 | 18 | 488 | 3,242 |
| Montgomery County | All ages | 71.8% | 74.0% | 18 | 15 | 2,052 | 11,993 |
| Montgomery County | Kittens | 74.6% | 78.7% | 16 | 14 | 999 | 5,235 |
| Montgomery County | Adults | 74.8% | 76.2% | 20 | 16 | 906 | 5,721 |
| Montgomery County | Seniors | 55.3% | 54.4% | 45 | 29 | 85 | 673 |
| Norfolk | All ages | 58.0% | 61.3% | 37 | 31 | 5,989 | 12,865 |
| Norfolk | Kittens | 65.7% | 68.8% | 41 | 37 | 3,294 | 6,862 |
| Norfolk | Adults | 45.0% | 50.9% | 25.5 | 21 | 2,100 | 4,756 |
| Norfolk | Seniors | 40.9% | 34.7% | 30 | 25 | 137 | 300 |
| Sacramento | All ages | 55.0% | 57.6% | 54 | 47 | 3,082 | 8,251 |
| Sonoma County | All ages | 42.6% | 48.1% | 28 | 27 | 1,442 | 8,385 |
| Sonoma County | Kittens | 59.3% | 65.4% | 29.5 | 26 | 782 | 4,580 |
| Sonoma County | Adults | 52.5% | 55.3% | 24.5 | 27 | 255 | 1,691 |
| Sonoma County | Seniors | 22.2% | 17.6% | 25 | 29 | 63 | 448 |
How much longer do black cats wait?
Among cats that were adopted, black cats had the longer median stay in seven of the eight datasets. Compared with cats of the same age at the same shelter, their stays were about 16% longer. In days, the extra wait is short: the median black kitten in the six datasets with full color records was adopted after 31 days, against 27 for other kittens, and the median black adult after 22.5 days, against 18.
The days here count the whole stay, from the day a cat arrived to the day it was adopted. The Colorado State study described below counted only the days after a cat was listed for adoption, so its numbers are not directly comparable with mine.
Black-and-white cats and other colors
Black-and-white cats, tuxedos included, were adopted as often as other cats. Their adoption odds were 0.99 times those of other colors, which is no real difference, though adopted black-and-white cats did stay about 9% longer. Against black-and-white cats alone, solid black cats still had about 10% lower adoption odds. The gap is tied to all-black coats. Brown tabbies, another dark coat, were adopted about as often as other cats.
| Coat color | Adoption odds | Stay of adopted cats | Cats |
|---|---|---|---|
| Torbie | 34% higher (1.34) | 2% longer (1.02) | 2,902 |
| Calico | 15% higher (1.15) | 7% shorter (0.93) | 6,045 |
| Tortoiseshell | 6% higher (1.06) | 4.5% longer (1.045) | 6,568 |
| Orange | about the same (1.03) | 8% shorter (0.92) | 18,603 |
| Gray | about the same (1.01) | 8% shorter (0.92) | 22,627 |
| Black and white | about the same (0.99) | 9% longer (1.09) | 15,134 |
| Brown tabby | about the same (0.98) | 4% longer (1.04) | 28,795 |
| Solid black | 12% lower (0.88) | 16% longer (1.16) | 17,228 |
| Solid white | 35% lower (0.65) | 7% shorter (0.93) | 1,502 |
Solid white cats had the biggest gap of any color, but they are a small group, 1,502 cats, and the records do not say why. Black cats are a much bigger group. About one in seven cats taken in at these six datasets (14.4%) is solid black, so even a small gap touches many cats.
What earlier studies and the ASPCA found
The three studies I read each looked at one or two shelters. The oldest covered 4,813 cats offered for adoption at a large municipal shelter in Sacramento County, California, from September 1994 to May 1995. Coat color was one of the main factors that predicted adoption, along with age, sex and the reason the cat was given up.9 A later paper sums up its color result: brown and black cats were less likely to be adopted, and white, color point and gray cats more likely.10 My data agrees about black cats and disagrees about white cats, which did worst here.
In 2013, Colorado State University researchers studied two Colorado shelters: 15,577 cats at one and 13,638 kittens at the other. Black cats took the longest to be adopted. At the first shelter, black adult cats averaged 26.55 days from going up for adoption to going home, against 20.64 days for cats of other colors, and black kittens averaged 18.03 days against 13.99.10 Even a few days matter, the authors note, because the longer a cat stays in a shelter, the more likely it is to catch an infection. My numbers point the same way and are a similar size, a few days. One difference: in their data, mostly black cats such as tuxedos also waited longer than other colors at one of the two shelters. In mine, black-and-white cats were adopted as often as other cats, though they stayed a little longer.
A 2020 study of 7,983 cats at an urban public shelter in Kentucky, using records from 2010 and 2011, found that black cats had the lowest adoption rate of any color group, 10.0%. Coat color as a whole explained very little about what happened to a cat, and the authors called their result weak support for black cat bias. Black cats did no better in October either.11 My data agrees on both points: the gap is real, and it is small. The setting differs. Adoption was rare for every color in that study, under 19%, while about half of the cats in my records were adopted.
In 2014 the ASPCA wrote: "Due to outdated (and incorrect) myths and superstitions, black cats have a really hard time getting adopted."12 Its own 2013 numbers from 14 communities, covering nearly 300,000 dogs and cats, looked calmer: black cats were 33% of the cats coming in and 31% of the cats adopted.13 Animal Sheltering magazine, from Humane World for Animals, read those numbers as showing that black cats are "just as likely to be adopted as any other cat."14
My records sit between those two readings. In the six datasets with full color records, black cats were 14.0% of the cats leaving and 13.2% of the cats adopted, a similar small shortfall to the one in the ASPCA's numbers. That is a gap, but about half of black cats still found homes. The ASPCA counted a much larger share of cats as black, 33% against 14.4% of intakes here. Adding black-and-white cats brings my share to 26.7%, so the two counts probably group colors differently.
How I counted
- Records. Eight public datasets from seven shelters, read on November 19, 2026: Austin Animal Center, Texas, in its old system (stays ending October 2013 to May 2025) and its new one (May 2025 to November 2026);12 Long Beach, California (2014 to 2026);3 Sonoma County, California (2014 to 2026);4 Norfolk, Virginia (2015 to April 2026);5 Montgomery County, Maryland (2017 to 2026);6 Louisville, Kentucky (2022 to 2026);7 and the City of Sacramento, California (2023 to July 2026).8 Long Beach and Austin records also feed my cat names study.
- Which cats count. Stays that began as a stray, an owner surrender, a returned adoption or a transfer in, and ended in adoption, transfer to another group, euthanasia or death: 157,959 stays, 26,928 of them black cats. Cats returned to their owners, returned to where they were found, still in foster care with no final result, or still at the shelter are left out.
- What is black. Solid black or black smoke, as staff recorded it. Black-and-white is its own group. Norfolk and Sacramento record only a cat's main color, so their black group includes some black-and-white cats. They appear in the shelter tables but not in the pooled odds, which use the six other datasets and 17,228 black cats with a known age. Adding them changes the odds ratio from 0.883 to 0.875.
- Rates and days. Adoption rate means adopted cats divided by adopted, transferred, euthanized and dead cats. Days to adoption run from arrival to adoption, for adopted cats only. A percentage point is the difference between two percentages, so 5.7 points means about 6 fewer adoptions per 100 cats.
- Ages. Kittens are under 1 year at arrival, adults 1 to 9 and seniors 10 and up. Louisville only separates kittens from older cats, and Sacramento records no ages.
- Same age, same shelter. The pooled odds compare black cats with other cats inside each shelter and age group (a Mantel-Haenszel odds ratio: 0.883, with a 95% range of 0.854 to 0.913). The stay comparison does the same with typical stay lengths. The age-group odds, the pooled shares by age, the outcome shares and the senior and adult comparison (five datasets with full color records that list seniors) come from my own script, run on the combined file with the same rules.
- Limits. Coat color is a staff judgment, and very dark tabbies or smoke cats can land in either group. A transferred cat may be adopted later, which these records cannot follow. Shelters run black cat promotions, and I did not adjust for them. Medians leave out cats still waiting when each file ends.
- Credit. Long Beach data: City of Long Beach Animal Care Services, Animal Shelter Data, licensed under CC BY 4.0,15 changed here by combining and counting the records. Louisville data: Louisville Metro, under its open data terms. Other data: City of Austin, Texas; County of Sonoma; City of Norfolk; Montgomery County, MD; City of Sacramento. None of these shelters, cities or counties reviewed or endorsed this page.
Use this data
Reporters, bloggers and teachers may quote these numbers and chart them, with a link to this page. That is the only condition. The full table of every shelter and age band, with black and other cats adopted and their median days, is in one file: black-cat-adoption-2026.csv.
At seven US animal shelters, a smaller share of black cats than of other cats was adopted, 51.8% against 53.6%, according to a count of 157,959 shelter records by Cat Trivia Games.
Source: Are Black Cats Adopted Less?, cattriviagames.com
Black Friday: how to help a black cat
Black Friday falls on November 27 this year, and some shelters have used it for black cat specials. In 2016, Seattle Humane waived adoption fees for black cats on Black Friday, and a spokesperson told KIRO 7 that "statistics reveal they spend more time in shelters."16 Animal Sheltering magazine describes a Nebraska shelter that uses the day to show off its black cats.14 Other shelters waive fees for every animal that day. In Palm Beach County, Florida, Peggy Adams Animal Rescue League lists a fee-free Black FURiday adoption event for November 27, 2026.17 Your local shelter's website will show its own plans.
- Adopt a black cat, especially an older one. In these records, black seniors were the least often adopted of the black cats, at 36.2%. The ASPCA encourages people to head to their local shelter and give a black cat or kitten a home.18
- Foster. A foster home frees a shelter space for another animal, lets new adopters meet the cat, and gives the cat more attention, which helps relieve its stress. The ASPCA suggests asking your local shelter how to become a foster caregiver.19
- Share a listing. If you are not ready to adopt, the ASPCA asks you to help spread the word.18 If you take photos for a shelter, the Colorado State researchers suggest brightly colored collars, better lighting and indoor spots with lots of windows for black cats.10
- Microchip your own cat. In a study of 53 shelters, microchipped cats got back to their owners 20 times as often as stray cats overall. A chip only helps if the registry has your current contact details, so keep them up to date.20
- Read the event terms first. Fee waivers differ from shelter to shelter, and some fees can still apply, such as the rabies tag fee for county residents at the Palm Beach County event.17
Think you can guess numbers like these? Play Cat Higher or Lower, a ten question game built from this site's own counts. Every data file is on the open data page.
Frequently asked questions
Are black cats euthanized more often in shelters?
A little more often in these records. In seven of the eight datasets, a slightly larger share of black cats than of other cats was euthanized. Across the six datasets with full color records it was 10.4% against 9.5%. The files hold no health or behavior details, so they cannot show whether color played any part.
Is Halloween a bad time to adopt a black cat?
Some shelters used to take black cats off the adoption floor around Halloween to protect them. A 2017 Animal Sheltering article urged shelters to drop the practice and quoted the chief of staff of San Diego Humane Society, which had done it for years: "What we had done was protect the animals to death."14 The Kentucky study found that black cats did no better in October either.11
Why might black cats wait longer?
Shelter records show what happened, not why. The Colorado State researchers suggest two reasons: black fur is harder to photograph, and old links to witches and superstition may lead some people to pick other colors.10 A Humane World for Animals expert put it this way: "The reality is that it's partly perception, but it's partly a numbers game."14
How well do you know cats?
Cat Trivia has questions on cat biology, behavior, breeds and history. It is free to play, with no account.
Play Cat TriviaUp next
 Cat FactsBlack Cat Facts, Trivia Questions and AnswersThe gene behind a black coat, the luck stories and the Bombay.
 Cat FactsMost Popular Cat Names 2026: Data From 4 Cities and a CountyLuna tops the license and shelter records of four cities.
 Cat FactsTuxedo Cat Facts: The Gene, Famous Tuxedos and the Smart MythWhy black-and-white cats look the way they do.
 Cat Facts151 Black Cat Names and Why Each One FitsIdeas for naming a newly adopted black cat.
Christopher writes and runs Cat Trivia Games. The datasets and studies behind this page are listed below, and how the site is made and corrected is on the editorial policy page. More about the author.
References
- City of Austin, Texas, data.austintexas.gov, public domain, read November 19, 2026. Austin Animal Center Intakes (10/01/2013 to 05/05/2025) and Austin Animal Center Outcomes (10/01/2013 to 05/05/2025). back
- City of Austin, Texas, data.austintexas.gov, no license stated on these datasets, read November 19, 2026. Austin Animal Center Intakes and Austin Animal Center Outcomes (new system). back
- City of Long Beach Animal Care Services, data.longbeach.gov, CC BY 4.0, read November 19, 2026. Animal Shelter Data. back
- County of Sonoma Department of Health Services, data.sonomacounty.ca.gov, no license stated on the dataset, read November 19, 2026. Animal Shelter Intake and Outcome. back
- City of Norfolk, data.norfolk.gov, no license stated on the dataset, read November 19, 2026. Norfolk Animal Care and Adoption Center (NACC). back
- Montgomery County, MD, dataMontgomery, public domain, read November 19, 2026. OAS - Animal Shelter Pathway. back
- Louisville Metro Animal Services, Louisville Metro open data (LOJIC), under the Open Data Platform Terms and Use, read November 19, 2026. Louisville Metro KY - Animal Service Intake and Outcome. back
- City of Sacramento, ArcGIS Hub, no license stated, read November 19, 2026. Animal Intakes and Outcomes for the Last 3 Years. back
- Lepper, Kass and Hart, Journal of Applied Animal Welfare Science, 2002, via PubMed. Prediction of adoption versus euthanasia among dogs and cats in a California animal shelter. back
- Kogan, Schoenfeld-Tacher and Hellyer, The Open Veterinary Science Journal, 2013 (Colorado State University). Cats in animal shelters: exploring the common perception that black cats take longer to adopt. back
- Carini, Sinski and Weber, Animals, 2020, via PubMed Central. Coat color and cat outcomes in an urban U.S. shelter. back
- ASPCA, August 14, 2014. Celebrate Black Cat Appreciation Day on August 17! back
- Vetstreet, Kristen Seymour, July 24, 2014, reporting the ASPCA's 2013 data. Is it a myth that black shelter pets are less likely to be adopted? back
- Animal Sheltering magazine, Humane World for Animals, Jodie Valade, Fall 2017. Who's afraid of a big black cat? back
- Creative Commons. Attribution 4.0 International (CC BY 4.0). back
- KIRO 7 News, Casey McNerthney, November 18, 2016. Black cats available without adoption fees on Black Friday. back
- Peggy Adams Animal Rescue League. Black FURiday adoption event, November 27, 2026. back
- ASPCA, August 14, 2018. Black Cat Appreciation Day is Friday. back
- ASPCA, Matt Bershadker, May 21, 2019. Seven reasons why fostering animals saves lives. back
- The Ohio State University, Ohio State News, October 11, 2009, on a study in the Journal of the American Veterinary Medical Association. Microchips result in higher rate of return of shelter animals to owners. back
Written by Christopher Fox under our editorial policy.