 Cat Trivia Games
iOS App
Kitten Season: When It Starts and Peaks, From Shelter Data
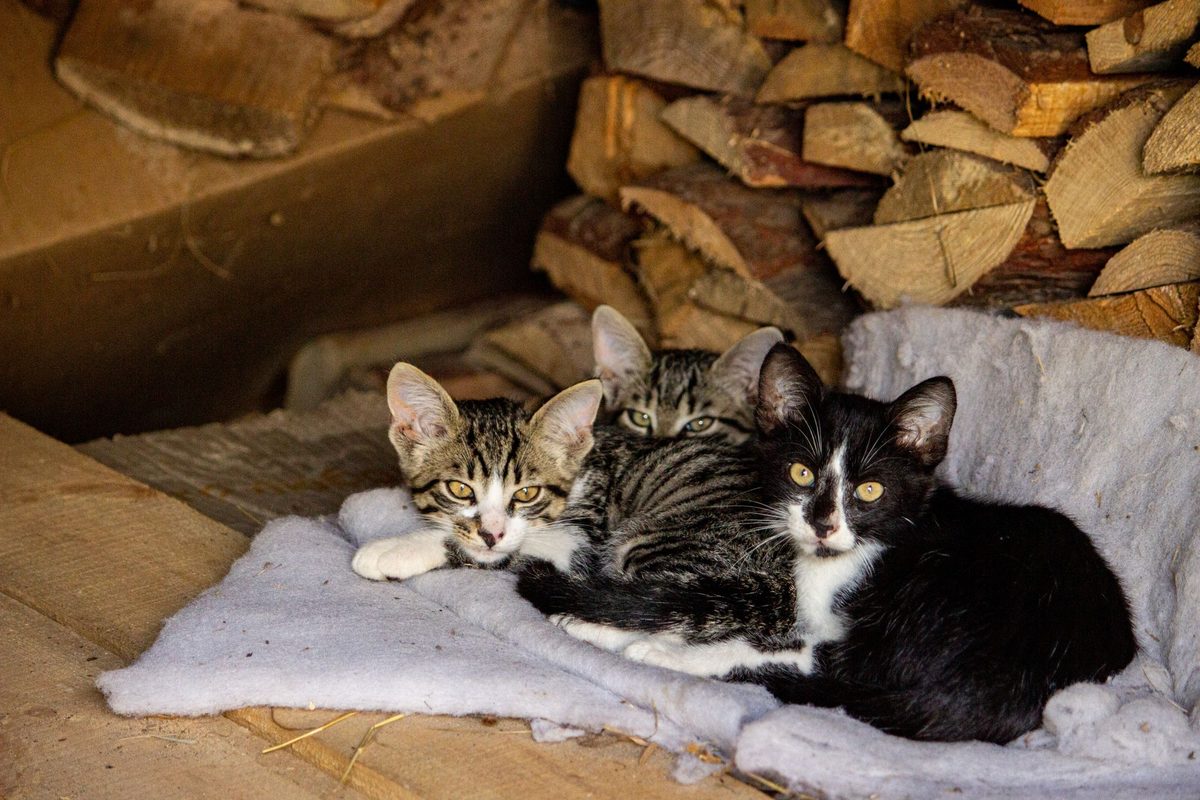
Kitten season runs from about April to October and peaks in late spring. I counted 132,353 kittens taken in by 11 animal shelters, ten in the United States and one in Canada. On average, June brought 13.8% of a shelter's kittens for the year and February only 2.6%, and 79.3% of kittens arrived from April to October. Adult cats barely follow the calendar: no month holds less than 7.4% or more than 9.4% of a year's adults.
Key findings
- June is the top month for kittens and February the lowest: 13.8% of a shelter's yearly kitten intakes against 2.6%, a gap of 5.3 times. These are averages of 11 shelters, so each shelter counts the same.
- Four in five kittens, 79.3%, arrive from April to October. Added up across the shelters, kitten intakes go from 5,279 in March to 9,934 in April and 17,008 in May.
- Adult cat intakes stay nearly flat, between 7.4% of the year in February and 9.4% in May. So the mix at the door changes: kittens are 36.1% of arriving cats in February and 71.7% in June.
- The youngest kittens come first. Kittens under 8 weeks old peak in May, kittens of 8 weeks to 6 months in July, and cats of 6 to 11 months in October.
- The peak month depends on the shelter: May at 3, June at 5, August at 2 and September at 1. Edmonton, Alberta, the one Canadian shelter, peaks in August.1 The US shelters do not line up by how far north they are.
Jump to: Month by month, Start and end, Youngest kittens, Every shelter, Place to place, Why it happens, Other counts, After intake, How to help, Use this data, Method
Kitten intakes month by month
The chart shows how a year's intakes are spread over the months, for kittens and for adult cats. A kitten here is a cat under 1 year old on the day it arrived. If cats arrived evenly, every month would hold about 8.3% of the year.
For kittens, every month from May to October is above that even share, and every month from November to April is below it. Adults move far less. Their busiest month, May, holds only 1.3 times the share of their quietest, February.
| Month | Kittens, share of year | Adults, share of year | Kitten intakes | Adult intakes | Kittens among arrivals |
|---|---|---|---|---|---|
| January | 3.1% | 7.6% | 4,206 | 7,327 | 38.9% |
| February | 2.6% | 7.4% | 3,484 | 6,899 | 36.1% |
| March | 3.9% | 8.0% | 5,279 | 7,652 | 43.8% |
| April | 7.1% | 8.0% | 9,934 | 7,729 | 60.6% |
| May | 12.4% | 9.4% | 17,008 | 8,840 | 70.4% |
| June | 13.8% | 8.9% | 17,738 | 8,614 | 71.7% |
| July | 12.0% | 8.8% | 15,463 | 8,612 | 68.1% |
| August | 12.1% | 8.9% | 16,006 | 8,721 | 68.0% |
| September | 11.6% | 8.4% | 15,247 | 8,025 | 69.5% |
| October | 10.3% | 9.1% | 13,410 | 8,404 | 65.0% |
| November | 6.6% | 7.9% | 8,683 | 7,247 | 58.1% |
| December | 4.4% | 7.7% | 5,895 | 6,818 | 49.2% |
| April to October | 79.3% | 61.5% | 104,806 | 58,945 | |
| Whole year | 100% | 100% | 132,353 | 94,888 |
The percentages are averages of the 11 shelters, so a large shelter such as Austin does not drown out a small one. The intake columns add the shelters together. Adding first and taking shares second gives nearly the same answer: 13.4% in June, 2.6% in February, and 79.2% from April to October.
When kitten season starts and ends
April is when the climb starts. Kitten intakes nearly double from March to April, from 5,279 to 9,934, and rise again to 17,008 in May. June is the high point at 17,738.
The season has no sharp end. July, August, September and October each still hold between 10.3% and 12.1% of a year's kittens. The drop comes in November, at 6.6%. December, January and February together hold 10.1%.
Shelter by shelter, the first month above an even share is April at 3 shelters, May at 6 and June at 2. The last such month is October at 10 shelters and November at one, Edmonton.
The mix of cats at the door changes with the season. Among cats with a recorded age, kittens were 36.1% of arrivals in February, 70.4% in May, 71.7% in June and still 49.2% in December.
The youngest kittens arrive first
Under 1 year is a wide group, so I split it at the 8 shelters that record ages in days and have enough kittens in every age group. The season is sharpest for the youngest. Kittens under 8 weeks old peak in May, with 16.6% of the year, and January and February hold 1.3% each. That is a gap of about 13 times.
| Age at intake | Peak month | Share in peak month | Lowest month | Share in lowest month | April to October | Cats |
|---|---|---|---|---|---|---|
| Under 8 weeks | May | 16.6% | January and February | 1.3% | 86.8% | 69,133 |
| 8 weeks to 6 months | July | 14.7% | April | 3.0% | 72.5% | 33,430 |
| 6 to 11 months | October | 11.0% | July | 5.2% | 52.0% | 10,826 |
Older kittens peak later: July for kittens of 8 weeks to 6 months, and October for cats of 6 to 11 months, whose low point is July. It looks like one wave of spring litters moving through the age groups as it grows up, though these records cannot follow a single litter. Ages of young kittens are estimates, often made from weight and teeth, so the lines between groups are soft. My kitten age chart shows what those ages look like week by week.
Every shelter's peak month
The 11 shelters are in Austin, Texas;2 Bloomington, Indiana;3 Broward County, Florida;4 Edmonton, Alberta;1 Long Beach, California;5 Louisville, Kentucky;6 Midland, Texas;7 Montgomery County, Maryland;8 Norfolk, Virginia;9 Riverside County, California;10 and Sonoma County, California.11 All of them show the same shape: a winter low and a long high season from spring to fall. The peak month holds 13.1% to 18.2% of a shelter's yearly kittens.
| Shelter | Peak month | Share in peak month | Lowest month | April to October | Months above an even share | Kittens | Full years | Top month by year |
|---|---|---|---|---|---|---|---|---|
| Austin, Texas | May | 15.1% | February (2.3%) | 80.6% | May to October | 44,066 | 2014 to 2024 | May in 7 of 11 |
| Long Beach, California | May | 15.1% | January (2.1%) | 82.4% | April to October | 16,519 | 2017 to 2025 | May in 5 of 9 |
| Broward County, Florida | May | 13.1% | February (3.0%) | 74.2% | April to October | 12,911 | 2022 to 2025 | May in 3 of 4 |
| Midland, Texas | June | 18.2% | January (1.0%) | 83.7% | April to October (not August) | 731 | 2025 | one year |
| Riverside County, California | June | 16.7% | February (2.8%) | 80.5% | May to October | 6,508 | 2024 | one year |
| Louisville, Kentucky | June | 15.2% | February (1.8%) | 83.8% | May to October | 5,666 | 2022 to 2025 | June in 3 of 4 |
| Norfolk, Virginia | June | 14.9% | February (2.5%) | 79.8% | May to October | 10,812 | 2015 to 2025 | June in 8 of 11 |
| Bloomington, Indiana | June | 13.3% | February (2.8%) | 77.2% | May to October | 8,828 | 2017 to 2025 | June and August, 4 of 9 each |
| Edmonton, Alberta | August | 14.7% | February (3.4%) | 76.0% | June to November | 12,567 | 2012 to 2022 | August in 5 of 11 |
| Montgomery County, Maryland | August | 13.2% | February (4.0%) | 72.3% | June to October | 8,292 | 2017 to 2025 | August in 5 of 9 |
| Sonoma County, California | September | 15.1% | February (1.7%) | 82.5% | May to October | 5,453 | 2014 to 2025 | September in 5 of 12 |
| Average of the 11 | June | 13.8% | February (2.6%) | 79.3% | May to October | 132,353 |
The top month also moves from year to year. In Austin, May led in 7 of 11 years. In Sonoma County, September led in 5 of 12 years, August in 3 and June in 2. Sonoma's season is closer to a plateau than a peak: June, July, August and September each hold 13.5% to 15.1% of its kittens.
One year stands out. In 2020 the peak came later than in any other year at four shelters: September in Austin and Bloomington, August in Long Beach and October in Edmonton. These are intake records. They show when shelters took kittens in, and that depends on how a shelter is running as well as on when kittens are born.
Three more shelters publish intake dates without usable ages, so I can only count their cats of all ages together. They show the same season. Dallas, Texas, peaks in May with 13.2% of its yearly cat intakes,12 the City of Sacramento, California, in May with 14.7%,13 and Los Angeles County, California, in August with 12.7%.14 Across all 14 shelters, June holds 12.1% of a year's cat intakes of every age and February 4.4%.
Does kitten season differ from place to place?
A little, in these records, and not in a tidy way. The three shelters that peak in May are all in the south: Austin, Long Beach and Broward County. But Midland and Riverside County are in the south too, and they peak in June, each on a single year of data. At most of these shelters May and June are close anyway. Austin has 15.1% of its kittens in May and 14.1% in June.
The later peaks do not follow the map either. Bloomington, Louisville and Montgomery County lie in the same middle band of the country, well north of Texas and Florida, and Sonoma County is in northern California. Their peak months are June, June, August and September.
Edmonton is the clearest case. It is far north of the other ten, and its season starts and ends later. Kitten intakes first pass an even share in June, peak in August at 14.7%, and are still at 8.5% in November. That fits the idea that kitten season comes later in colder places. One shelter cannot prove it, and Edmonton counts kittens by its own Kitten label, not by an age in days.
Published research also finds little difference inside the United States. A 2006 study looked at 103,643 feral cats at seven trap-neuter-return programs, from Honolulu to Seattle. Pregnancy peaked in March and April at every one of them, regardless of location.15 The ASPCA describes kitten season as coming in the warmer months in some areas and all year round in others.16 All 11 of my shelters have a clear winter low, so none of them shows a year-round season.
Shelters can also manage intake, for example by booking intakes by appointment or by sending kittens to foster homes first. Either would flatten or shift a recorded peak, and the files do not say when that happened. A late peak in one county may say as much about the shelter's calendar as about its cats.
Why kitten season happens
Cats breed by day length. A veterinary textbook chapter on cat reproduction describes the cat as a long-day breeder. In the northern hemisphere, the longer days of January and February start female cats' heat cycles. Heat activity usually peaks from February to April, and regular cycles can go on until as late as October or November.17 Cornell's shelter medicine program puts it plainly: cats are seasonal breeders, and the hours of daylight influence their reproductive activity.18
The timing fits the shelter records. Pregnancy in cats lasts 65 to 67 days on average.17 In the feral cat study, pregnancy peaked in March and April at 36.8% to 58.0% of female cats, depending on the program, and every program's lowest rates, under 3.5%, came between October and December.15 Count about two months on from March and April, and the big wave of litters is born in late spring. In my records, kittens under 8 weeks old peak in May.
The long tail has causes too. A cat can have one or two litters in a season,18 and a female kitten's first heat typically comes at 5 to 9 months of age.17 The ASPCA warns that breeding can begin before kittens are six months old.19
How my numbers compare with other counts
Cornell's shelter medicine program, using Shelter Animals Count data, describes cat intake as highest from May to October and lowest from December to February, a curve it calls kitten mountain.18 My records agree. For cats of all ages, the three lowest months are February, January and December, and for kittens every month from May to October is above an even share. Together those six months hold 72.2% of a year's kittens.
In 2018 the ASPCA described the season at its New York City kitten nursery as running from April through October.20 Those are the same seven months that hold 79.3% of the kittens in my count.
I differ in one place. The ASPCA has also described kitten season as the high breeding period between spring and summer.21 Breeding may peak then, but shelter intakes stay high into fall. September holds 11.6% of a year's kittens and October 10.3%, both more than April's 7.1%.
Kittens, adults and seniors after intake
Kitten season fills shelters with the cats that are adopted most often. In eight datasets from seven shelters that record both age and how each stay ended, 59.0% of kittens left by adoption, against 50.3% of adults aged 1 to 9 and 36.1% of seniors aged 10 and up.
The most adopted group, and the fastest, was cats that arrived at 6 to 11 months old: 68.6% were adopted, after a typical wait of 11.9 days. Kittens under 6 months were adopted 60.9% of the time but waited 30.4 days, likely because the youngest must grow and be spayed or neutered first. Cats aged 13 and older were adopted 24.0% of the time, after 26.8 days.
Age shapes a shelter stay more than coat color does. In my count of black cat adoption rates, black cats had about 12% lower odds of adoption than other cats. For seniors against younger adults, the odds here are about half.
What you can do in kitten season
- Foster. A foster home frees a shelter space for another animal, and very young kittens often need care around the clock. The ASPCA suggests asking your local shelter how to become a foster caregiver.21
- Adopt an adult or a senior. Adult cats keep arriving all through kitten season, and they are adopted less often than kittens: 50.3% of adults and 36.1% of seniors in my records, against 59.0% of kittens.
- Spay or neuter. The ASPCA says it is generally considered safe to spay or neuter kittens as young as eight weeks old, and it advises booking the surgery before a cat reaches five months of age.22 Your veterinarian can tell you the right time for your cat.
- Found kittens outside? Wait and watch first. Their mother may be close by, and Cornell's shelter medicine program calls her the very best caretaker for them.18 If the kittens look healthy, the ASPCA recommends leaving them where they are and checking over a few hours to see if she returns. Kittens that look ill or injured should go to a shelter, a rescue or a veterinary clinic as soon as possible, and it helps to call first.19
Use this data
Reporters, bloggers and teachers may quote these numbers and chart them, with a link to this page. That is the only condition. The month-by-month table, with kitten and adult intakes, both kinds of share and every shelter's kitten share by month, is in one file: kitten-season-2026.csv.
June brings 13.8% of a shelter's yearly kitten intakes and February 2.6%, and 79.3% of kittens arrive from April to October, according to a count of 132,353 kitten intakes at 11 shelters by Cat Trivia Games.
Source: Kitten Season: When It Starts and Peaks, cattriviagames.com
How I counted
- The records. On November 19, 2026, I combined public shelter records from 16 open datasets into one table of 539,395 cat stays. This page uses the 14 shelters whose records give intake dates for at least one full calendar year: 451,052 cat intakes, 132,353 of them kittens and 94,888 adults at the 11 shelters that record age. The same kind of open records is behind my count of the most popular cat names.
- Full years only. I counted complete calendar years, so a half year cannot tilt the months. The years for each shelter are in the shelter table. Riverside County and Midland have one full year each. Austin's newer record system starts in May 2025 and has no full year yet, so the season count uses Austin's older system only.
- Left out. 31,065 records of cats that were dead on arrival or brought in for disposal or cremation.
- Kitten or adult. A kitten is under 1 year old at intake, from the date of birth or the shelter's own age field. Louisville uses a kitten size code and Edmonton its Kitten animal type. Adults are every cat aged 1 year or more, seniors included.
- Shares. For each shelter I took each month's share of the year's intakes, then averaged the shelters. An even share is 100% divided by 12 months, about 8.3%. Months are not adjusted for length, so February, the shortest month, looks a little lower than it would per day. Rounded shares may not add up to exactly 100%.
- Year-by-year peaks. The top month in each year, for years with at least 100 kittens at that shelter. Long Beach and Bloomington have a few stray earlier records, and their data really starts in 2017.
- Age groups. The 8 shelters with ages in days and at least 300 kittens in every group: Austin, Bloomington, Broward County, Long Beach, Montgomery County, Norfolk, Riverside County and Sonoma County. Under 8 weeks means under 56 days, the middle group is 56 to 182 days, and 6 to 11 months is 183 to 364 days. Bloomington's ages are worked back from the age on file, so they are rough.
- After intake. Eight datasets from seven shelters: Austin in both record systems,223 Broward County, Long Beach, Montgomery County, Norfolk, Riverside County and Sonoma County. The cats counted are stays that began as a stray, an owner surrender, a returned adoption or a transfer in, and ended in adoption, transfer, euthanasia or death. The shares for kittens, adults and seniors pool the datasets. The finer age groups are averages of the datasets' own shares, and a typical wait is the average of their median days from intake to adoption.
- Limits. These are intake records, so they follow shelter practice as well as births. Kitten ages are estimates. The shelters are the ones that publish open data, not a sample of every shelter, and only one is outside the United States. The earlier studies I cite measured other things, such as pregnancy in feral cats, so the comparisons are rough.
- Credit. Long Beach data: City of Long Beach Animal Care Services, Animal Shelter Data, licensed under CC BY 4.0,24 changed here by combining and counting the records. Louisville data: Louisville Metro, under its open data terms. Edmonton data: City of Edmonton, under its open data terms of use. Other data: the cities and counties named in the references. None of these shelters, cities or counties reviewed or endorsed this page.
Think you can guess numbers like these? Play Cat Higher or Lower, a ten question game built from this site's own counts. Every data file is on the open data page.
Frequently asked questions
When is the best time to adopt a cat?
Any month works, because shelters have cats all year. Kittens are most plentiful from May to October, when they are 65.0% to 71.7% of arriving cats. Adult cats arrive at a steady rate in every month. Shelters take in the most cats in May and June, so an adoption then frees a space when it is needed most. December is fine too: in my count of cats adopted at Christmas, December adoptions came back no more often than those from other months.
Are kittens born in winter too?
Yes, just far fewer. December, January and February together hold 10.1% of a year's kitten intakes in my records. In the feral cat study, pregnancies occurred all year round, and every program's lowest rates, under 3.5% of females, came between October and December.15
Do indoor cats follow kitten season?
Often, yes. Cats that live indoors but mostly under natural light cycle with the seasons, and most indoor cats in North America stop cycling in winter because the days are short. The same textbook chapter advises breeders to give cats 12 to 14 hours of light a day for regular cycles.17
Test your cat knowledge
You have seen the kitten numbers. Now see how much you know about cats. Cat Trivia is free to play, with no account.
Play Cat TriviaUp next
 Cat FactsKitten Age Chart: How to Tell a Kitten's Age Week by WeekHow to tell a kitten's age, week by week.
 Cat FactsAre Black Cats Adopted Less? Adoption Rates at 7 SheltersAdoption rates at seven shelters, from the same records.
 Cat FactsAre Cats Adopted at Christmas Returned More Often?Are December adoptions returned more often? The shelter data says no.
 Cat FactsMost Popular Cat Names 2026: Data From 4 Cities and a CountyLuna leads in every city, counted from license and shelter records.

Christopher writes and runs Cat Trivia Games. The datasets and studies behind this page are listed below, and how the site is made and corrected is on the editorial policy page. More about the author.
References
- City of Edmonton, Alberta, Animal Care and Control Centre, data.edmonton.ca, City of Edmonton open data terms of use, read November 19, 2026. Animals Admitted to the Animal Care & Control Centre. back
- City of Austin, Texas, data.austintexas.gov, public domain, read November 19, 2026. Austin Animal Center Intakes (10/01/2013 to 05/05/2025) and Austin Animal Center Outcomes (10/01/2013 to 05/05/2025). back
- City of Bloomington, Indiana, Bloomington Animal Care and Control, data.bloomington.in.gov, no license stated on the dataset, read November 19, 2026. Animal Shelter Animals. back
- Broward County, Florida, Animal Care and Adoption, ArcGIS Online, Broward County Terms of Use, read November 19, 2026. Animal_Care_Intake_and_Outcome_Data. back
- City of Long Beach Animal Care Services, data.longbeach.gov, CC BY 4.0, read November 19, 2026. Animal Shelter Data. back
- Louisville Metro Animal Services, LOJIC open data, Open Data Platform Terms and Use, read November 19, 2026. Louisville Metro KY - Animal Service Intake and Outcome. back
- City of Midland, Texas, Animal Services, ArcGIS Online, no license granted, data provided as is, read November 19, 2026. Animal Intake (public view). back
- Montgomery County, MD, Office of Animal Services, dataMontgomery, public domain, read November 19, 2026. OAS - Animal Shelter Pathway. back
- City of Norfolk, Virginia, data.norfolk.gov, no license stated on the dataset, read November 19, 2026. Norfolk Animal Care and Adoption Center (NACC). back
- County of Riverside, Department of Animal Services, data.countyofriverside.us, no license stated on the dataset, read November 19, 2026. Animal Services, Animal Impound Report. back
- County of Sonoma, Department of Health Services, data.sonomacounty.ca.gov, no license stated on the dataset, read November 19, 2026. Animal Shelter Intake and Outcome. back
- City of Dallas, Dallas Animal Services, www.dallasopendata.com, no license stated on the dataset, read November 19, 2026. Dallas Animal Shelter Data Fiscal Year 2000 - Present and Dallas Animal Shelter Data FY 2023 - 2026. back
- City of Sacramento, ArcGIS Hub, no license stated, read November 19, 2026. Animal Intakes and Outcomes for the Last 3 Years. back
- County of Los Angeles, Department of Animal Care and Control, ArcGIS Online, no license stated, read November 19, 2026. Animal Care PawStats Data. back
- Wallace, J. L., and Levy, J. K. (2006). Population characteristics of feral cats admitted to seven trap-neuter-return programs in the United States. Journal of Feline Medicine and Surgery, 8(4), 279 to 284. doi:10.1016/j.jfms.2006.02.004. Read on PubMed Central, November 19, 2026. Full text (PMC10822539). back
- ASPCA, Matt Bershadker, May 24, 2024, read November 19, 2026. Be Part of The Rescue Effect: Save Lives and Find Companionship During Adopt a Shelter Cat Month. back
- Little, S. E. (2012). Female Reproduction. In The Cat, pages 1195 to 1227. Elsevier. doi:10.1016/B978-1-4377-0660-4.00040-5. Read on PubMed Central, November 19, 2026. Full text (PMC7158189). back
- Lena DeTar, Maddie's Shelter Medicine Program, Cornell University College of Veterinary Medicine, June 1, 2023, read November 19, 2026. What is "Kitten Mountain" and How Can I Help? back
- ASPCA, read November 19, 2026. I Found Kittens Outside, What Do I Do? back
- ASPCA, May 14, 2018, read November 19, 2026. A Kitten's Journey: Caring for Our Smallest Residents at the ASPCA Kitten Nursery. back
- ASPCA, Matt Bershadker, May 21, 2019, read November 19, 2026. Seven Reasons Why Fostering Animals Saves Lives. back
- ASPCA, read November 19, 2026. Spay/Neuter Your Pet. back
- City of Austin, Texas, data.austintexas.gov, no license stated on the dataset, read November 19, 2026. Austin Animal Center Intakes and Austin Animal Center Outcomes. back
- Creative Commons. Attribution 4.0 International (CC BY 4.0). back
Written by Christopher Fox under our editorial policy.